
You can view and edit basic information and appearance for each Dashlet on your dashboard using the Dashlet properties. For some Dashlets, you can also create parameters which you can then map to in the filter manager. The available properties vary based on the type of Dashlet you are working with.
To view and edit the Dashlet properties, complete the following steps:
-
Right-click on the Dashlet and select Properties from the context-menu to open the Dashlet Properties window. The Hyperlinks tab is only available for Ad Hoc-based charts charts created inside the dashboard, and as text and image Dashlets. A Formatting tab is also available for Text Dashlets.
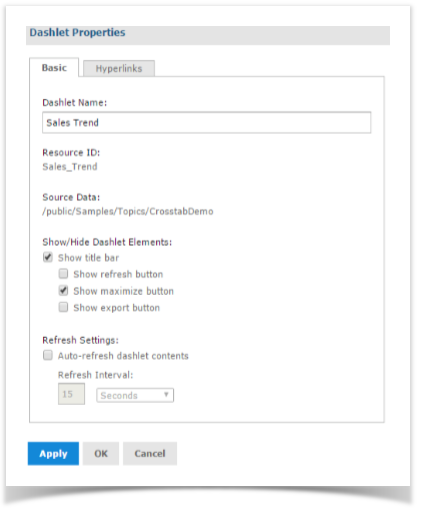
- Click the Apply button to view the changes, the OK button to accept the changes, and the Cancel button to discard the changes.
Properties for Dashlets containing charts, crosstabs, tables, reports, and Ad Hoc views include:
- Dashlet Name: Editable field for the displayed Dashlet name.
- Resource ID: Non-editable ID taken from the original Dashlet name.
- Source Data: Non-editable path of the source data.
- Show/Hide Dashlet elements: Select or deselect to show or hide the title bar, which includes the Dashlet name, refresh button, and maximize button.
- Scale to Fit: Use the drop-down menu to determine how the element is scaled in the Dashlet.
-
Refresh Settings: Select or deselect to enable or disable auto-refresh, and use the text entry and drop- down menu to set the time between each content refresh.
These setting overrides refresh properties set at the dashboard level.
Properties on the Hyperlink tab for Dashlets containing charts include:
- Enable chart hyperlinks: Select or deselect to enable a hyperlink for the Dashlet.
-
Action: Select link behavior for this Dashlet:
-
Update dashboard: Select this option to update Dashlets linked to this one when a user clicks on a data point in the chart.
-
Open new page: Select this to have the Dashlet open a web page or report, dashboard, or an Ad Hoc view in the repository when a user clicks on the Dashlet.
 You can link directly to a web page using http: syntax: http://en.wikipedia.org/wiki/$P\{Customer Country}

A repository URL must begin with repo:, for example: repo:/public/Samples/Ad_Hoc_Views/report_id
You can link directly to a web page using http: syntax: http://en.wikipedia.org/wiki/$P\{Customer Country}
A repository URL must begin with repo:, for example: repo:/public/Samples/Ad_Hoc_Views/report_idTo find the correct syntax for a path in the repository, hover over the resource name in the Existing Content panel in the Dashboard Designer or open the resource's Properties dialog from the repository.
To find the correct syntax for a path in the repository, hover over the resource name in the Existing Content panel in the Dashboard Designer or open the resource's Properties dialog from the repository.
You can add a parameter to a hyperlink for a web page, dashboard, or report. Parameters are not available for Ad Hoc views
-
- Available Parameters: when you add a parameter, use a name in this list to have the filter manager create the link to the parameter automatically.
- Add New Parameter: For text and image Dashlets, you can define a parameter to include in the hyperlink. Click the Add New Parameter button and enter the parameter's name and value in the new table row.
- Map Parameters: When you add a parameter, click this button to save and close the Dashlet Properties window and open the Parameter Mapping window.
Properties for Dashlets containing text include:
- Dashlet Name: editable field for the displayed Dashlet name.
- Resource ID: non-editable ID taken from the original Dashlet name.
- Text: editable field for the text displayed in the Dashlet.
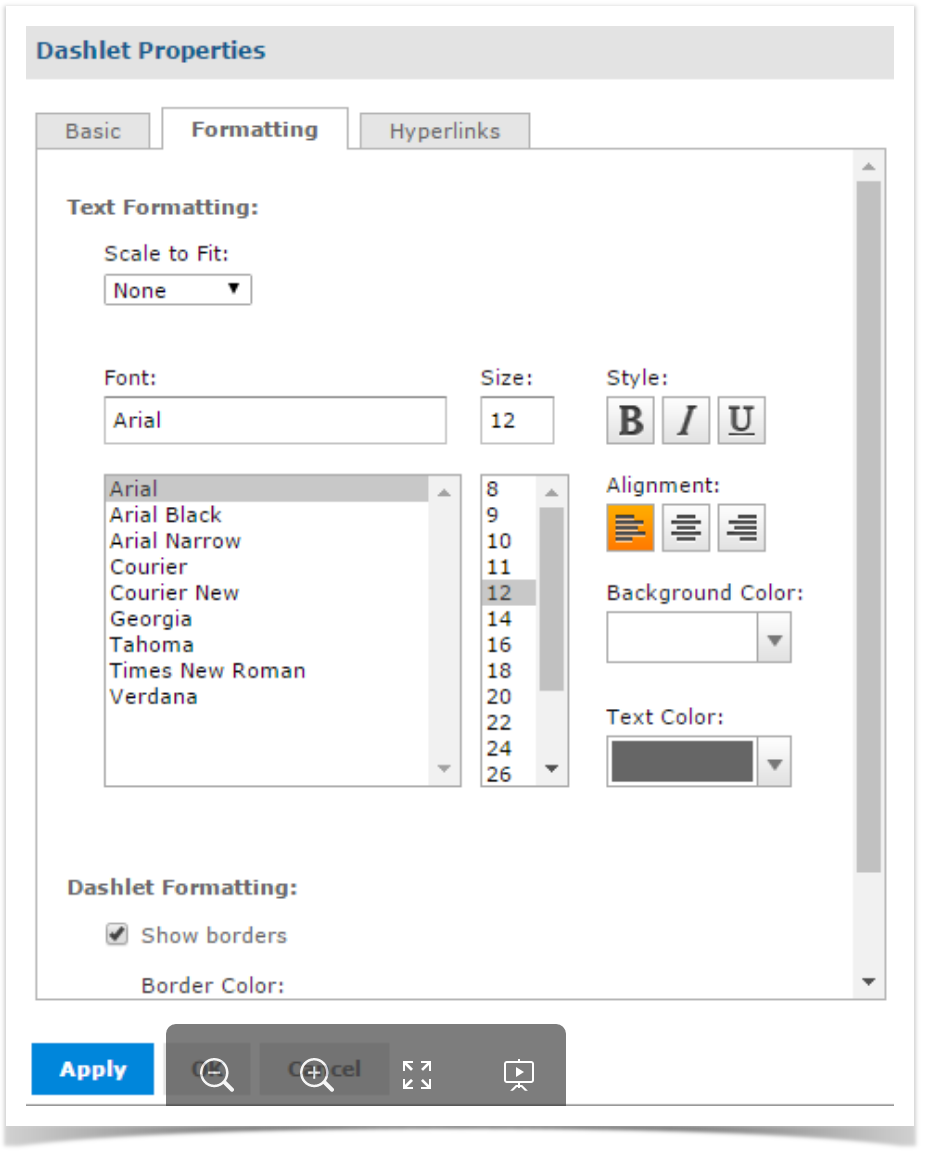
- Scale to Fit: Use the drop-down menu to determine how the text is scaled in the Dashlet. This overrides the specified font size.
- Font: Use the selection lists and buttons to set the font, font size, font style, alignment, and font color for the text displayed in the Dashlet.
- Show Borders: Select or deselect to show or hide the Dashlet's border. If you select to show the Dashlet's border, you can choose the border's color.
Properties for Dashlets containing a Web Page include:
- Dashlet Name: editable field for the displayed Dashlet name.
- Resource ID: non-editable ID taken from the original Dashlet name.
- Web Page Address (URL): editable field for the URL displayed in the Dashlet.
- Show/Hide Dashlet elements: select or deselect to show or hide the title bar, which includes the Dashlet name, Refresh button, and Maximize button.
- Show scroll bars: select or deselect to show or hide scroll bars.
-
Refresh Settings: select or deselect to enable or disable auto-refresh, and use the text entry and drop- down menu to set the time between each content refresh. These setting overrides refresh properties set at the Dashboard level.
Properties for Dashlets containing a filter include:
- Dashlet Name: editable field for the displayed Dashlet name.
- Resource ID: non-editable ID taken from the original Dashlet name.
- Show/Hide Dashlet buttons: select or deselect to show or hide the Apply button or Reset button.
-
Position of Dashlet buttons: use the drop-down menu to select bottom or right.
-
Chart, Crosstab, and Table Dashlets
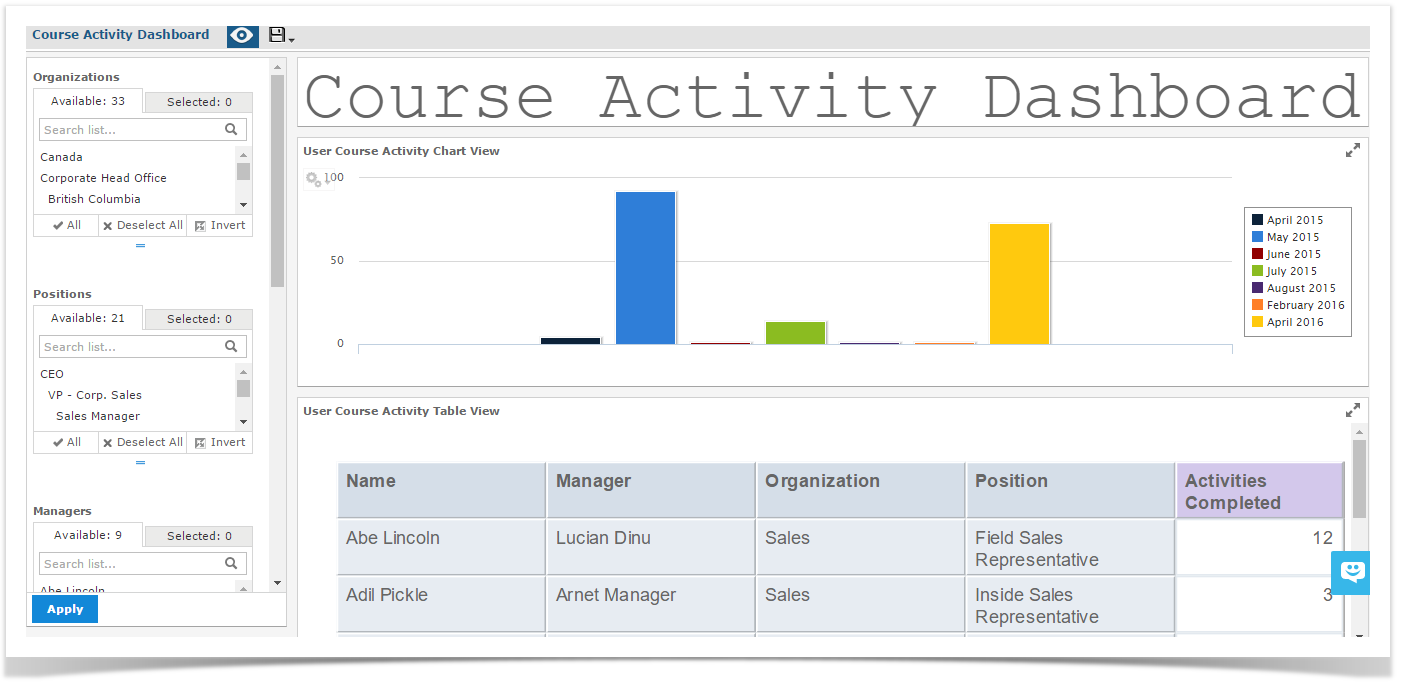
The heart of creating a Lambda Zoola™ Dashboard is the ability to include and cross-reference Charts, Crosstabs, and Tables as Dashlets. In the image below, the Course activity Dashboard contains:
- User Activity Course Chart View
- User Activity Course Table View
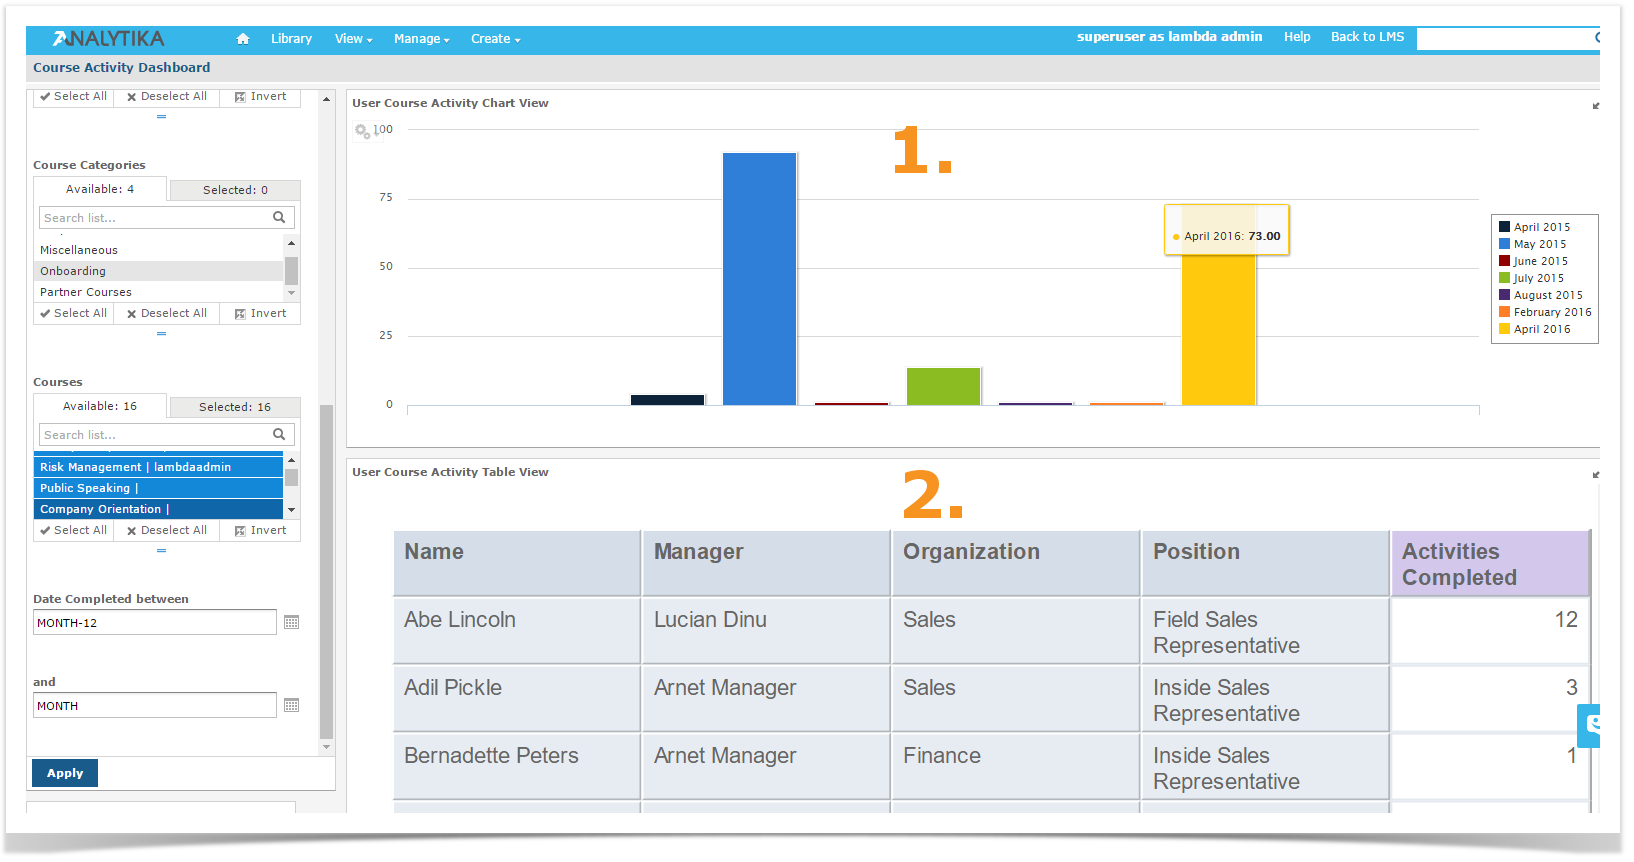
The Dashboard Designer interface allows you to include Charts, Tables, and Crosstabs as Dashlets in two unique ways:
- Existing Charts, Crosstabs, and Tables: The Lambda Zoola™ Dashboard Designer allows you to select existing Charts, Crosstabs, and Tables to include in your Dashboard (if you have the necessary permissions to view and use them).
- New Charts, Crosstabs, and Tables: The Dashboard Designer includes an on-board Ad Hoc Editor, which allows you to create Charts, Crosstabs, and Tables for your Dashboard without leaving the designer environment (any Chart, Crosstab, or Table you create within the Dashboard Designer is only available on the current Dashboard; otherwise, they function like standard Ad Hoc Editor-created versions of these elements. They are saved as an Ad Hoc view, and placed in a Dashlet on your dashboard).
-
Adding Chart, Crosstab, and Table Dashlets
To add a new chart, crosstab, or table to your dashboard, complete the following steps:
- In the New Content section of the Available Content panel, click and drag the type of element you want to add to your Dashboard (Chart, Crosstab, or Table) onto the Dashboard Canvas. The designer's Ad Hoc Editor opens, and the Select Data dialog appears.
-
Browse to or search for the data source you want to use:
- Click the View as Tree button for a tree view of the files.
- Click View as List button for a list view of the files.
- Click in the text entry box to search for a specific data source.
- Depending on your selected data source, the remaining steps may vary. Follow the on-screen instructions to navigate through the Data Chooser. You can also refer to the earlier guide on using the Data Chooser.
- When you complete the data source selection process, click the OK button. The Data Chooser window closes and the on-board Ad Hoc Editor becomes available. The on-board Ad Hoc Editor works just like the standard editor.
- When you finish creating your view, click the Save button to save.
- In the Save to Dashboard dialog, enter a dashlet name and click Save. The dashlet is added to your dashboard.
Text Dashlets
The Lambda Zoola™ Dashboard Designer allows you to insert Text Dashlets into your Dashboard to provide contextual information and formatted titles to your Dashboard. The following image is a version of the Course Activity Dashboard, containing a modified Text Dashlet as a Title:
When working with Web Page Dashlets in the Dashboard Designer, you can include a parameter reference in the Dashlet's URL. The parameter references an existing filter in another Dashlet, and uses that filter to display a specific web page relevant to the filtered information.
The following example takes you through the steps for creating a simple Dashboard in the Dashboard Designer, adding a sample chart with geographic filters, and creating a Web Page Dashlet that displays a Wikipedia page for the country the sample chart is filtered on.
First, create the simple dashboard:- From the Home page. Click Create > Dashboard. The Dashboard Designer appears, displaying the list of available content and the canvas.
- In the Existing Content section of the Available Content panel, find and select a Report.
- Click and drag the Report onto the Dashboard Canvas.
- Next, add the Filter input control to the Dashboard:
-
- In the Filters section, expand the folder.
- Drag the Customer Country input control onto the canvas.
Now, add the Web Page Dashlet with the parameter reference and add it to the filter:
- In the New Content section of the Available Content panel, click and drag the Web Page item onto your Dashboard. The Dashlet URL window opens.
- Enter the following URL: http://en.wikipedia.org/wiki/$P\{Customer Country}
- Click the OK button.
- Right-click the Dashlet and select Properties from the context-menu.
- Change the Dashlet Name to "Wiki."
- Click the Parameter Mapping icon to open the Parameter Mapping window.
- Open a row containing the new Affected Dashlet and Filter/Parameter dropdown menus that appear.
- In the Dashlet Affected column, select "wiki" from the new Select dashlet dropdown menu.
- In the Filter/Parameter Affected column, select a field from the new Select parameter dropdown menu.
- Click the OK button.
Finally, preview the new Dashboard functionality:
- Preview the Dashboard.
- Click in the text box to display the available values.
- Select a value from the values list, and click the Apply button at the bottom of the Dashlet.
- Return to the Dashboard Designer.
- Select Save Dashboard.
- In the Save As window, change the default name and locate a folder, such as the /Dashboards folder.
- Click Save.
You can add a Dashlet displaying a web page to your Dashboard.
To add a web page Dashlet, complete the following steps:
- In the New Content section of the Available Content panel, click and drag the Web Page item onto your Dashboard. The Dashlet URL window opens.
- Enter the URL you want to appear on your Dashboard.
-
Click the OK button. Edit the Dashlet name and font appearance by opening the Properties dialog.
Adding an Image Dashlet
To add an Image Dashlet to your Dashboard, complete the following steps:
- In the New Content section of the Available Content panel, click and drag the Image item onto your Dashboard. The Dashlet Image window opens.
-
In the Web Address/Respoitory URI field, enter the URI for the image you want to appear on your Dashboard.
If you are linking an image from your Repository, begin your URI with the syntax: "repo:" -
Click the OK button to save your changes. The image Dashlet is added to your Dashboard.
You can edit the Dashlet name by open the Properties dialog of the Dashlet. See Introduction to Dashboards for more information.
Image Dashlets
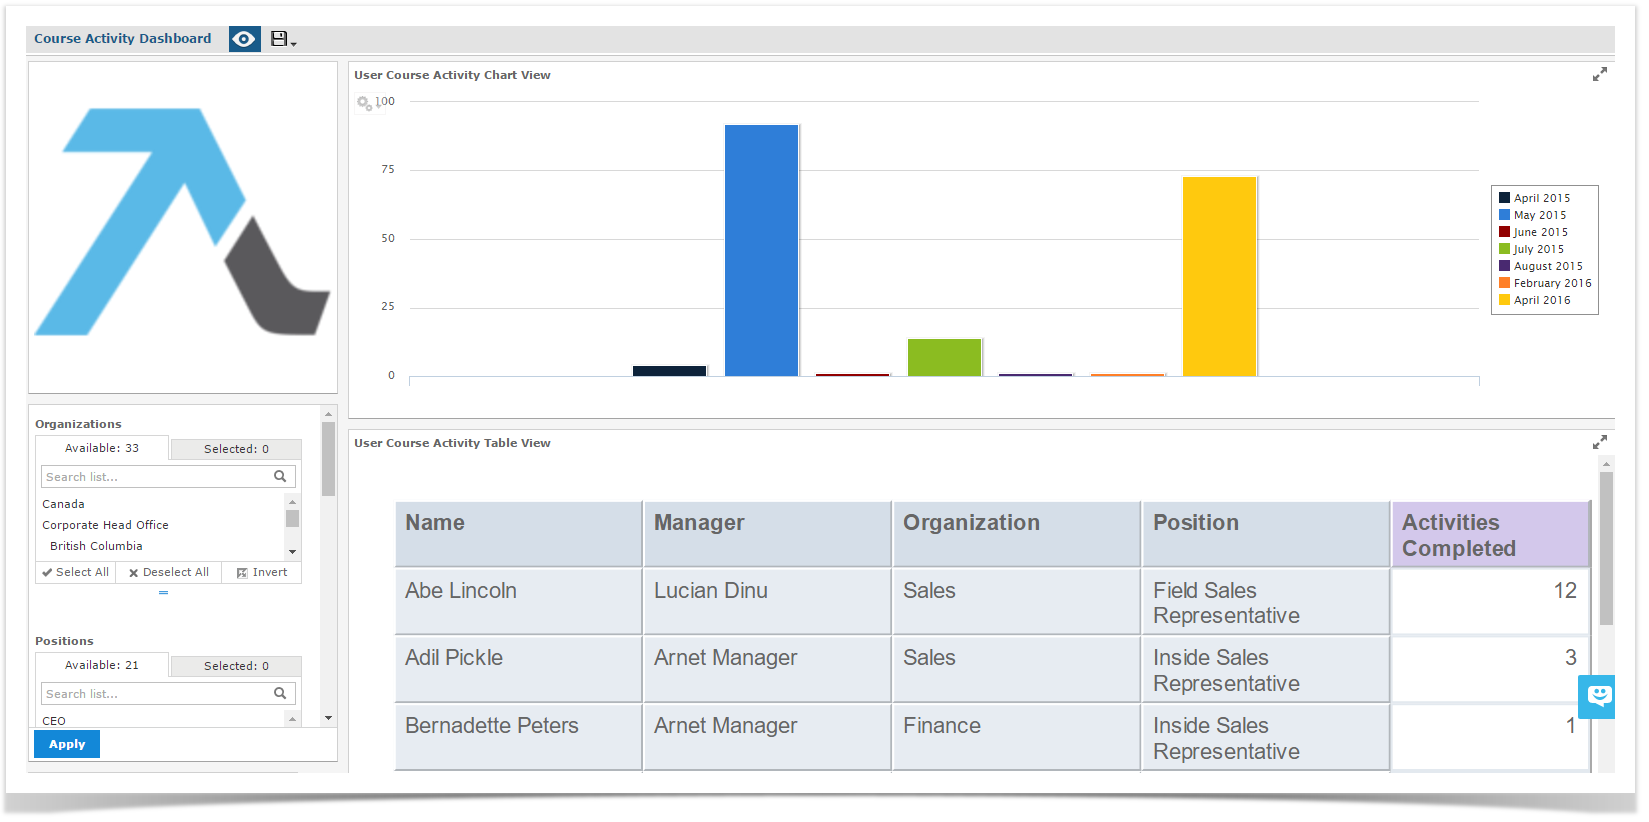
The Lambda Zoola™ Dashboard Designer allows you to insert Image Dashlets into your Dashboard to include logos, pictures, and any other visual content to keep your Dashboards branded and vivid.
You can insert an image as a Dashlet by providing either a Repository URI or a web address. The following Dashboard is a version of the Course Activity Dashboard, containing an Image Dashlet of the Lambda Solutions logo:
Comments
Article is closed for comments.