
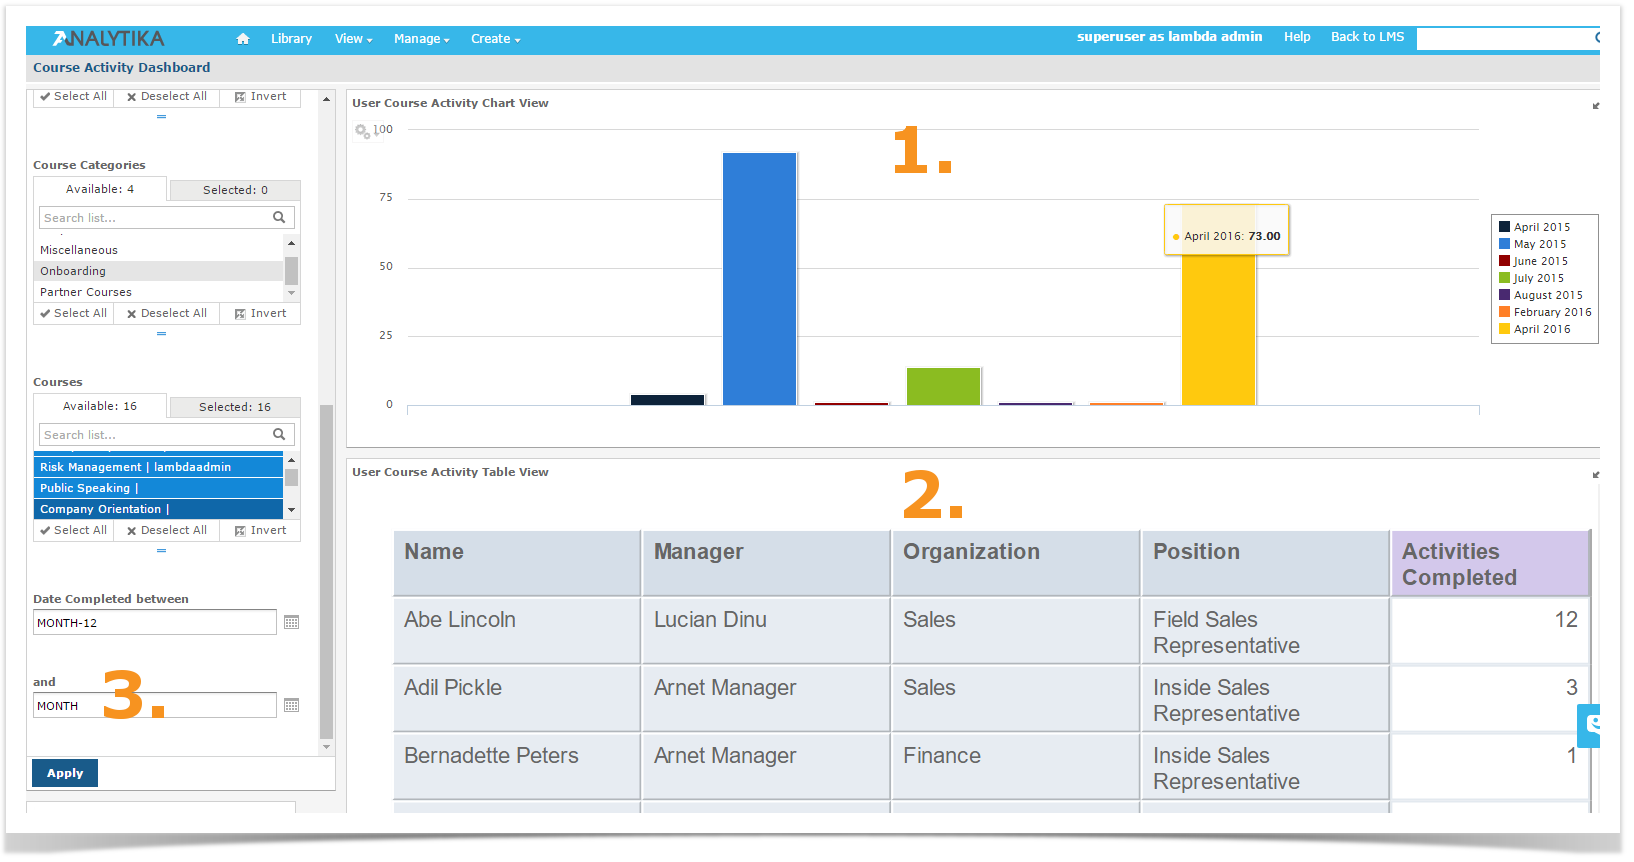
Dashboards are comprised of Dashlets, which consist of Ad Hoc Views, Filters, and Reports. You can pull in Dashlets and connect them through Filters and Parameters to create cross-functional analysis and beautiful visualizations. The Course Activity Dashboard shown in the image below contains the following dashlets:
- User Course Activity Chart View: An Ad Hoc View Bar Chart pulled in from the Public > Totara > Ad Hoc Components > Views folder of the Repository.
- User Activity Course Table View: An Ad Hoc View Table pulled in from the Public > Totara > Ad Hoc Components > Views folder of the Repository.
- Filters: Filters associated to Dashlets 1 and 2 have been pulled into the Dashboard as one multi-functional Dashlet.
Comments
Article is closed for comments.